- Pedestrian fatality: 5% at 35 km/h or below, 45% at 55 km/h, above 100 km/h.
- At 50 km/h severe injuries low; at 80 km/h injuries high; above 120 km/h fatal.
- Below 50 km/h, serious injuries about 1%; 80 km/h, high risk; above 120 km/h, fatal.
Road safety is a major concern in Romania and worldwide, with road crashes claiming thousands of lives each year. Excessive speed remains one of the main factors shaping crash severity and the likelihood of survival for victims. Understanding the correlation between traveling speed and the risk of death can contribute to more preventive and responsible driving.
Statistical data and international studies demonstrate a direct link between vehicle speed and injury severity in crashes. This analysis does not aim to alarm, but to inform and promote defensive driving that adapts continuously to traffic conditions.
Impact of speed on pedestrians
Pedestrian-vehicle collisions represent a particularly vulnerable category of accidents, where vehicle speed plays a decisive role in the probability of survival.
Relative safety zone (below 35 km/h)
At speeds of up to 35 km/h, the chances of a pedestrian dying as a result of the impact are relatively low—about 5%. At these speeds, the vehicle has enough braking distance, and the kinetic energy transmitted on impact is considerably reduced.
Main types of injuries at low speeds include:
- Contusions and fractures of the lower limbs
- Head trauma from impact with the windshield
- Secondary injuries from falls on the road surface
Critical zone (35-55 km/h)
Increasing speed by only 15-20 km/h leads to a dramatic escalation in risk. At 55 km/h, the probability of a pedestrian fatality reaches 45% — a ninefold increase compared with 35 km/h.
Lethal zone (above 80 km/h)
At speeds of 100 km/h and above, a pedestrian’s survival in an impact becomes statistically almost impossible. The enormous kinetic energy and deceleration forces exceed the human body’s capacity to withstand trauma.

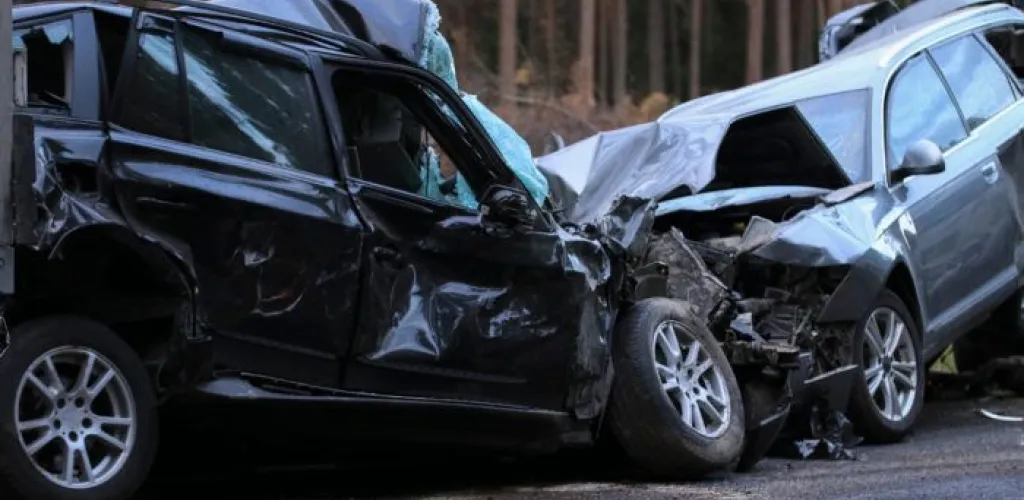
Vehicle collisions — risk factors
Crashes have a complex dynamic, influenced by many factors beyond the simple velocity alone.
Types of impact and their consequences
Frontal impact represents the most dangerous type of collision, because:
- Deceleration forces act directly on occupants
- The deformation time of the vehicle is minimal
- Internal organs suffer trauma from inertia
Side impact can be just as devastating, especially when:
- There is not enough side deformation space
- The impact occurs at door level
- The relative speed between vehicles is high
Speed and fatality risk statistics
Accident data analysis reveals the following correlations:

- At lower speeds (below 50 km/h): risk of serious injuries is about 1%
- At 80 km/h: probability of injury reaches 69%, while serious injuries reach 52%
- Above 120 km/h: fatal crashes become almost inevitable
Accident physics — why speed kills
Kinetic energy and impact
The kinetic energy of a vehicle is calculated as E = ½mv², where:
- m = mass of the vehicle
- v = speed (squared)
This formula explains why doubling the speed results in a fourfold increase in impact energy.
Deceleration and effects on the human body
During an accident, it is not the speed itself that kills, but the abrupt deceleration. The human body can withstand substantial g-forces only for very short periods:
- 20-25 G for 0.1 seconds — survival threshold
- 50 G for 0.02 seconds — potentially lethal
- 100 G or more — fatal in most cases
Designed deformation zones
Modern cars are designed with crumple zones that:
- Absorb impact energy over a longer period
- Reduce deceleration forces on occupants
- Protect the passenger cabin through controlled deformation of the hood and trunk
Factors that amplify risks
Reaction time
At higher speeds, the available time to react reduces dramatically:
- At 50 km/h: Standard reaction time (1.5 seconds) translates to 21 meters traveled
- At 100 km/h: The same time covers 42 meters
- At 150 km/h: Distance increases to 63 meters
Braking distance
The required stopping distance increases exponentially with speed:
- 50 km/h: about 25 meters on dry pavement
- 90 km/h: about 80 meters
- 130 km/h: over 140 meters
Road conditions
Factors such as:
- Wet or icy road surfaces
- Reduced visibility
- Heavy traffic
- Winding roads
further reduce safety at high speeds.
The importance of safety systems
Passive safety systems
- Airbags: reduce impact forces on the body
- Seatbelt: distribute forces over a larger area
- Active head restraints: protect against cervical injuries
Active safety systems
- ABS: maintains steering control during braking
- ESP: prevents skidding in curves
- Emergency Brake Assist: reduces impact speed
Recommendations for safer driving
Adapting speed to conditions
- Respect speed limits as the maximum allowed, not as a target
- Reduce speed in adverse conditions
- Increase following distance at high speeds
Choosing a safe vehicle
Before buying your next car, consider the safety it offers. Euro NCAP tests show how safe a vehicle is and help you make an informed choice.
Ongoing road education
- Defensive driving courses
- Understanding the vehicle’s physical limits
- Awareness of risks associated with speed
Understanding these statistics and the physics of crashes can save lives. Every driver’s responsibility is to adjust speed to conditions and prioritize safety over time gained through excessive speed.